TL;DR:
Transportation is the movement of people and goods, plus the system of infrastructure, vehicles, operations and institutions that makes that movement possible. It matters because it converts distance into access, and access decides who can reach jobs, healthcare and education. In Australia, transport takes 15.8% of the typical household’s income, contributes almost 8% of GDP, and produces around a fifth of national emissions.
Key takeaways
- Transport costs the typical Australian household 15.8% of its income, up from 13.9% before the pandemic.
- Total transport activity contributes around 7.9% of Australia’s GDP, second only to mining.
- Australia’s road toll has risen for 35 consecutive months, against a national target to halve it by 2030.
- Transport is Australia’s third largest emitting sector at roughly 22% of national emissions.
- Whether transport helps or hurts you depends heavily on where you live and which modes you can reach.
Table of contents
- What does transportation actually mean?
- Transport or transportation: which word is right in Australia?
- What are the main modes of transport?
- Which mode does what? A comparison
- How big is transport in the Australian economy?
- What does transport cost an Australian household?
- Why does access matter more than speed?
- How dangerous is Australia’s transport system?
- What is transport’s environmental cost?
- What makes a transport system good?
- The bottom line
- Frequently asked questions
What does transportation actually mean?
Transportation is the movement of people and goods from one place to another, and the organised system that enables it.
Most definitions stop at the first half. That is why most definitions are useless.
The system has four parts:
| Part | What it is | Examples |
| Infrastructure | The fixed network | Roads, rail corridors, ports, airports, footpaths, pipelines |
| Vehicles | The moving assets | Cars, trucks, trains, ships, aircraft, bicycles |
| Operations | The coordination layer | Timetables, traffic signals, air traffic control, freight scheduling |
| Institutions | The money and the rules | Transport departments, regulators, toll operators, councils |
Change any one part and the other three respond.
Economists call transport a derived demand. Almost nobody wants a bus trip for its own sake. They want the job, the appointment or the class at the other end.
That single idea explains most transport policy fights. Build for movement, and you get more movement. Build for access, and you get people reaching things.
Transport or transportation: which word is right in Australia?
Australians say “transport”. Americans say “transportation”. They mean the same thing.
Australian government agencies use the shorter form almost exclusively, from the federal Department of Infrastructure and Transport through to Transport for NSW.
Three related terms get confused with it:
- Logistics is narrower. It covers the planning, storage and coordination of freight, including warehousing, and treats transport as one component.
- Mobility is broader. It describes a person’s total ability to move, including options they do not own, such as ride-share, e-scooters and on-demand buses.
- Active transport means human-powered movement: walking, cycling, wheeling. Australian health and planning agencies use the term constantly, and it belongs on any honest list of modes.
What are the main modes of transport?
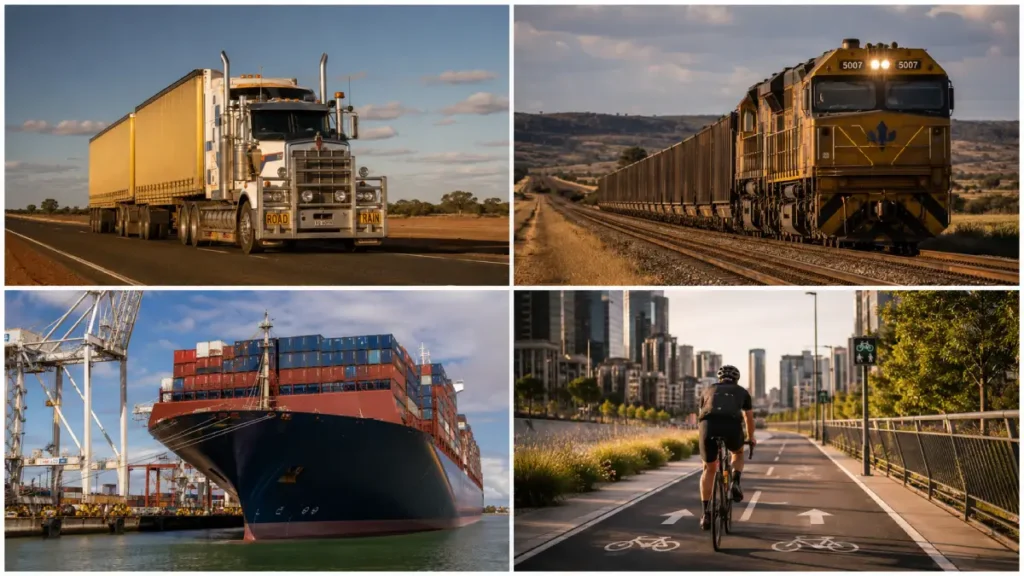
Six modes carry everything Australia moves: road, rail, sea, air, pipeline and active transport.
Road dominates passenger travel and non-bulk freight. Road freight grew from about 29 billion tonne-kilometres in 1976–77 to 163 billion tonne-kilometres in 2021–22, driven mainly by consumer goods. That freight task also includes specialised loads that don’t fit standard categories: caravans, machinery, and boats moved interstate by operators such as Interstate Boat Transport, rather than sailed or towed the full distance.
Rail carries bulk. Australia exported 895 million tonnes of iron ore and 338 million tonnes of coal in 2022–23, most of it railed to port. Its share of general freight has collapsed, for reasons covered below.
Sea carries almost all of Australia’s international trade by weight. No other mode moves bulk commodities across oceans at a viable price.
Air carries what cannot wait: people over long distances, medical freight, high-value electronics.
Pipelines move gas and liquids continuously with almost no labour.
Active transport covers the first and last kilometre of nearly every other trip. This is why footpath quality shapes public transport patronage.
Which mode does what? A comparison
| Mode | Moves best | Australian scale | Main strength | Main limitation |
| Road | Consumer goods, short and medium haul, most passenger trips | 163 billion tonne-km of freight (2021–22) | Door to door, no transfer needed | 86% of transport emissions; highest death toll |
| Rail | Bulk minerals, grain, long-haul containers | 57% of the national freight task for 4% of transport emissions | Lowest emissions and crash cost per tonne-km | Fixed routes; still needs trucks at both ends |
| Sea | Exports, imports, bulk commodities | 895 Mt iron ore exported in 2022–23 | Cheapest per tonne over distance | Slow; entirely port-dependent |
| Air | Long-distance passengers, urgent freight | Around 7% of transport emissions | Speed no other mode matches | Highest cost and emissions per passenger-km |
| Pipeline | Gas, fuels, water | Continuous national gas networks | Minimal labour, no traffic | One commodity, one route, permanent |
| Active | Trips under about 5 km | Every first and last kilometre | Zero emissions, direct health benefit | Pedestrian deaths rose 9.9% and cyclist deaths 9.3% in the year to April 2026 |
Note on sources: the rail comparison figures come from the Australasian Railway Association, an industry body with a commercial interest in shifting freight to rail. Treat them as directional rather than neutral.
How big is transport in the Australian economy?
Transport is not a support function in Australia. It is one of the largest sectors outright.
Total transport activity contributed $164.4 billion to the Australian economy in 2020–21, or 7.9% of GDP, making it the second largest contributor behind mining. Around 1.2 million people worked in it.
Of that total, $86.8 billion came from the transport industry itself. The remaining $77.7 billion came from in-house transport inside other industries, led by construction at $40.3 billion.
That second number matters more than it looks. Most transport activity happens inside businesses that do not call themselves transport companies.
On direct employment, transport, postal and warehousing is the main job for around 745,400 people, roughly 5.1% of the Australian workforce. Road freight is the largest sector and truck driving the largest occupation, with truck driver salaries in Australia among the more competitive rates within the transport, postal and warehousing industry.
The physical task keeps growing. Australia’s domestic freight task hit its highest recorded point in 2024–25 at 786 billion tonne-kilometres, and BITRE projects around 964 billion by 2049–50.
What does transport cost an Australian household?
Transport ranks behind only housing and food in most Australian household budgets, and it has grown faster than both since 2019.
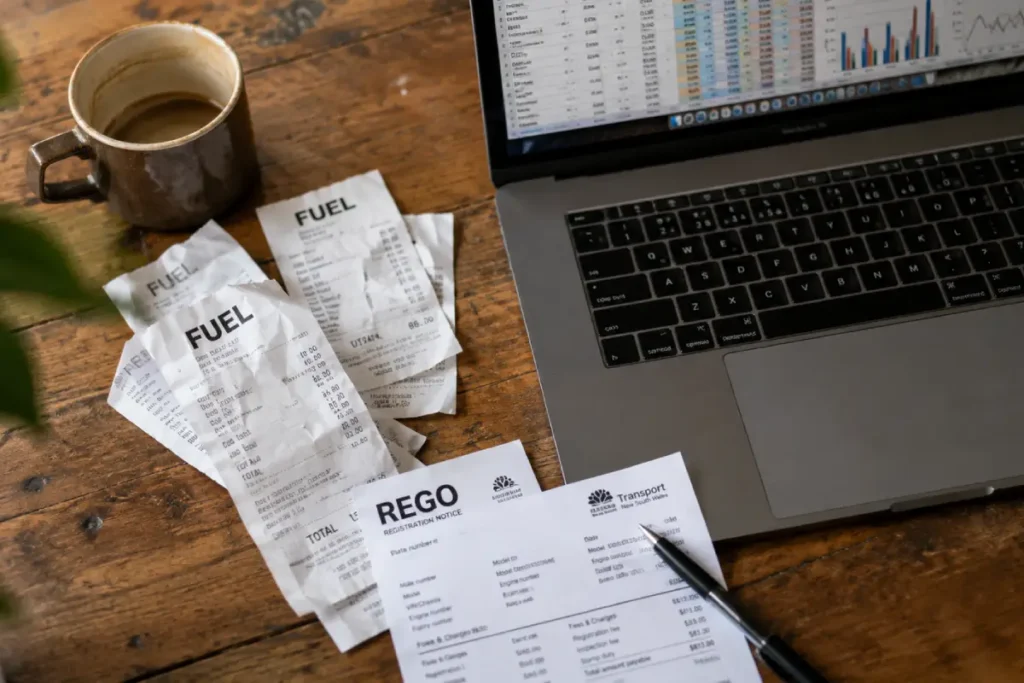
In the December 2025 quarter, transport consumed 15.8% of the typical capital city household’s income and 15.4% for benchmark regional centres, according to the AAA Transport Affordability Index. That share peaked at 17% in June 2024 and sat at 13.9% before the pandemic.
The trap is geographic. Households move outward chasing cheaper housing, then pay the difference back in fuel, tolls, servicing and a second car.
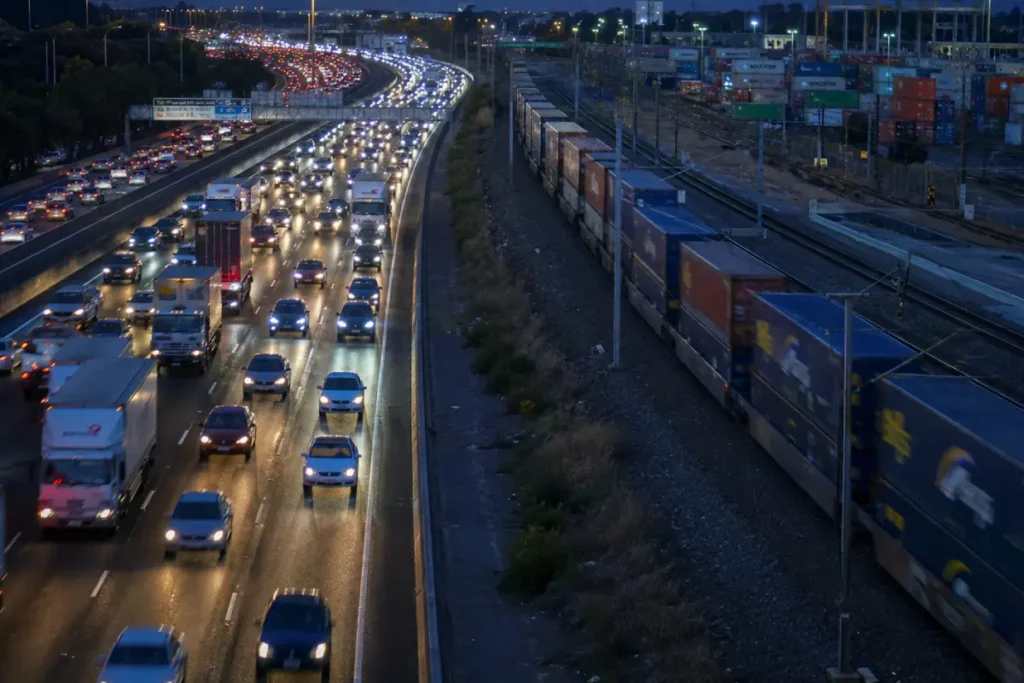
Congestion compounds it. Infrastructure Australia estimated road congestion and public transport crowding cost the economy $19.0 billion in 2016, and projected that to more than double to $39.8 billion by 2031 without matching investment.
Those costs never appear on anyone’s bill. They arrive as time you do not get back, and as freight surcharges built into retail prices.
Why does access matter more than speed?
Ask what a transport system is for and the honest answer is access, not speed. A fast road that reaches nothing useful has failed.
Access shapes real outcomes. A household without a car in an outer suburb with hourly buses faces a smaller job market than a household two suburbs closer to a train line, regardless of qualifications.
Researchers call this transport disadvantage, and it stacks. People on lower incomes get pushed toward cheaper housing further from services, then need more expensive transport to reach those services.
Regional Australians carry a version of the same problem. Distance to specialist healthcare, tertiary education and competitive labour markets is a transport variable long before it becomes a health or education one.
This is why “importance” is not an abstraction. Transport quality sets the size of the world a person can practically reach.
How dangerous is Australia’s transport system?
Australia’s road toll is rising, and has been for years.
There were 1,333 road deaths in the year to 30 April 2026, a 3.5% increase and the 35th consecutive month of year-on-year rises. Deaths have climbed 21.5% since the National Road Safety Strategy 2021–30 began.
That strategy set out to halve deaths by 2030. So far it has delivered the opposite result.
BITRE recorded 1,336 deaths in the 12 months to February 2026, a rate of 4.8 per 100,000 people. Serious injuries run at roughly thirty times the fatality count.
Mode choice moves this number. The Australasian Railway Association estimates road crash costs run about 20 times higher than rail per tonne-kilometre of freight, and that a single heavy vehicle can do up to 20,000 times more damage to a road surface than a passenger car.
What is transport’s environmental cost?
Transport is Australia’s third largest emitting sector and the hardest one to shift.
Direct transport emissions account for around 22% of Australia’s total. Passenger cars and light commercial vehicles alone contribute 60% of transport emissions and over 10% of the national total.
The trend has only just turned. Transport emissions fell 0.6% in the year to December 2025, from 101.5 to 100.8 million tonnes of CO2 equivalent, driven largely by a 3% drop in petrol consumption. Electric vehicles grew from under 4% of new light vehicle sales in 2022 to more than 20% in the first four months of 2026.
Freight is the harder half. Non-bulk rail’s share fell to 16.7% by 2021–22 while trucks took almost 80%. In that same year, the Australian Rail Track Corporation had $153 million to maintain 7,500 kilometres of interstate network.
The rail industry estimates rail freight produces 16 times less carbon pollution than road freight per tonne-kilometre. The figure comes from a lobby group, but the direction is not seriously disputed.
What makes a transport system good?
Six criteria, and no system maximises all six at once.
| Criterion | What it measures |
| Access | How many jobs, schools and services a person reaches in a reasonable time |
| Reliability | Whether the trip takes the same time on Tuesday as it did on Monday |
| Affordability | The share of household income the system consumes |
| Safety | Deaths and serious injuries per kilometre travelled |
| Resilience | How the network copes when a flood closes a highway or a port stops |
| Emissions | The climate cost per person or tonne moved |
Every real transport decision trades between these. A new motorway can improve reliability while worsening affordability and emissions, because it moves people further out.
The bottom line
Transportation is the movement of people and goods, and the system of infrastructure, vehicles, operations and institutions behind it. It matters because it converts distance into access, and access determines what a person can practically reach.
The Australian evidence points in four directions at once. Transport is one of the largest contributors to national output and employment. It consumes a share of household income that has not returned to pre-pandemic levels. It kills more people each year than it did the year before. And it produces roughly a fifth of national emissions, with a decline that has only just begun.
Whether transport works as an enabler or a burden genuinely depends on the reader. It depends on where you live, how far you sit from a train line, whether your household can run one car instead of two, and whether your region’s freight moves by rail or by road.
There is no single verdict available. A household near frequent public transport and a household forty kilometres out with hourly buses live inside the same national system and get opposite results from it. That gap, more than any national average, is the thing worth arguing about.